How to Use Our Tools
Complete step-by-step guides for merging, splitting, converting, and transforming Excel files and PDFs. Every feature explained in detail.
Merge Excel Files
Combine multiple Excel spreadsheets (XLS, XLSX, CSV) into one file with smart column matching, conflict resolution, and 100% privacy.
ドラッグ&ドロップまたはクリックで選択
ホームページのドラッグ&ドロップゾーンを使用して、2つ以上のExcelファイルをアップロードします。XLS(Excel 97-2003)、XLSX(Excel 2007+)、CSVファイルに対応し、異なるフォーマットを1回の結合で混在させることもできます。ファイルはアップロードゾーンの下に名前、サイズ、検出されたシートと共にリスト表示されます。グリップハンドルをドラッグしてファイルの順序を変更したり、削除ボタンで個別のファイルを削除できます。
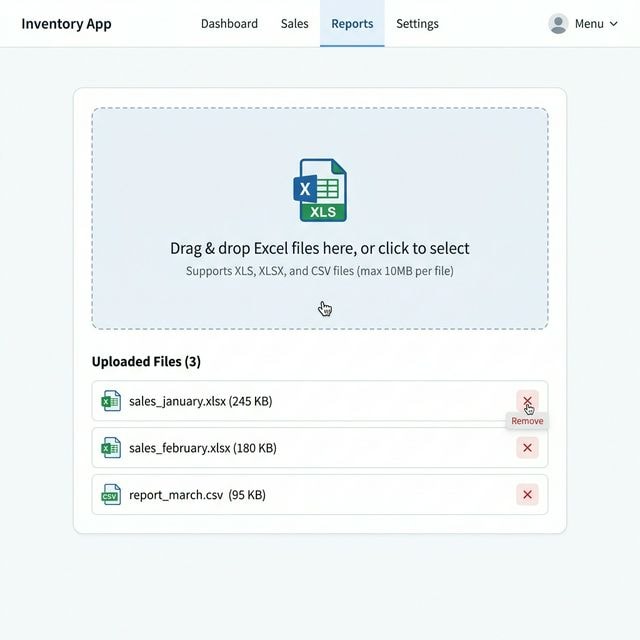
売上レポート、アンケート回答、データベースエクスポートなど、XLS、XLSX、CSV形式であれば異なるソースのファイルをアップロードできます。
ファイルの結合方法を選択
右側パネルで3つの結合モードから選択:「単一スプレッドシート」はすべてのデータを1つの連続シートに積み重ね、類似データの結合に最適。「複数シート」は各ファイルを1つのワークブック内の別タブとして配置、ソース別にデータを整理するのに理想的。「選択的結合」は各ワークブックから特定のシートを選択可能 — 複数シートを含むファイルから特定のものだけが必要な場合に最適。
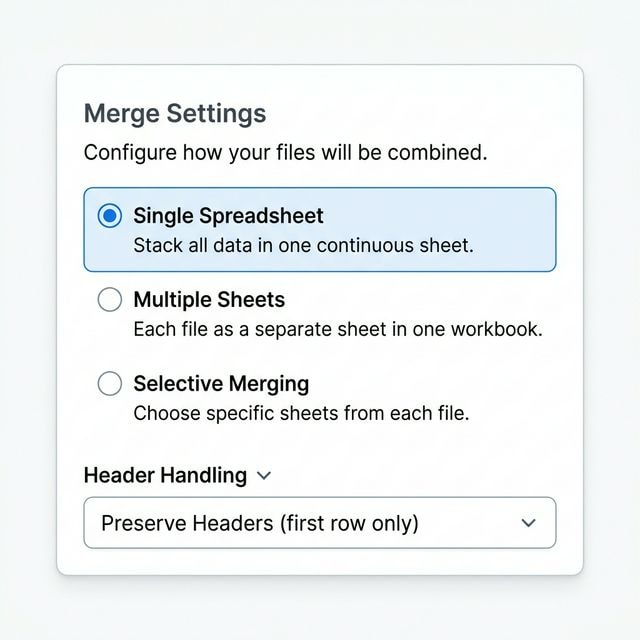
すべてのファイルが同じ列構造を共有している場合(月次売上レポートなど)は「単一スプレッドシート」を使用。ソースファイルごとにデータを分けたい場合は「複数シート」を使用。
ヘッダー処理、データ範囲、書式設定を微調整
詳細オプションで結合方法をカスタマイズ。「ヘッダー処理」で列ヘッダーの扱いを制御 — 最初の行のヘッダーのみ保持、データソースを識別するためのシート名ラベル追加、またはヘッダー処理なし。「データ範囲」でセル範囲を指定(例:A1からZ1000)して各ファイルの一部のみを結合。「書式保持」を有効にすると、元のセルスタイル、色、書式を結合出力に保持。
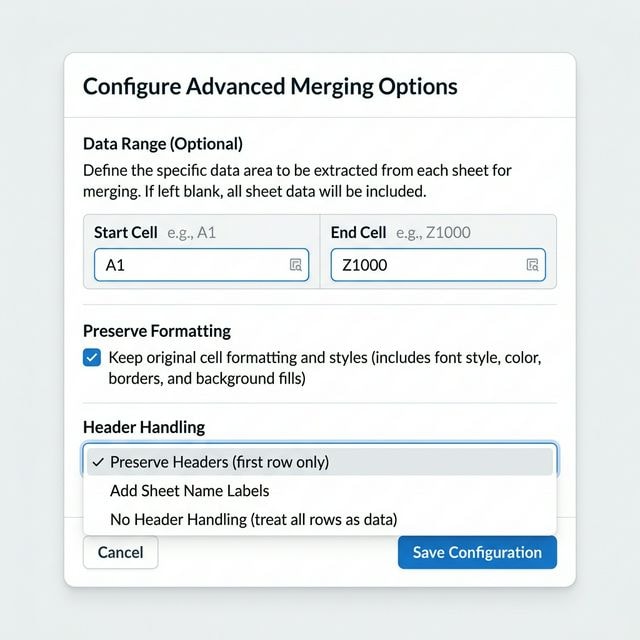
ファイルの最初の行にヘッダーがある場合は、結合出力でヘッダー行の重複を避けるため、常に「ヘッダー保持」を使用してください。
スマートマッチングが異なる列構造を整列
単一スプレッドシートモードで結合する場合、ツールは全ファイルの列ヘッダーを自動分析します。列が正確に一致しない場合 — 例えば一方のファイルに「顧客名」、もう一方に「クライアント名」がある場合 — 列の不一致ダイアログが表示されます。ドロップダウンメニューで手動マッピングするか、「そのまま続行」をクリックして再マッピングなしで結合できます。ファジーマッチングアルゴリズムが最適な一致を自動提案します。
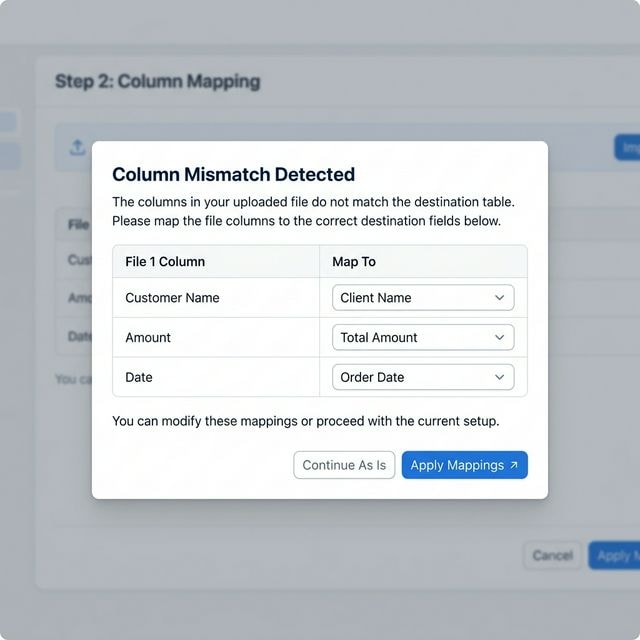
列の競合解決は単一スプレッドシートモードでのみ表示されます。競合を完全に避けたい場合は、代わりに複数シートモードを使用してください。
複数シートのワークブックから含めるシートを選択
複数シートを含むExcelファイルをアップロードすると、結合オプションの下にシート選択パネルが表示されます。各ファイルについて、個別のシートにチェックを入れたり外したりして、結合に含めるか除外するかを選択できます。「すべて」と「なし」ボタンで素早く選択。チェックを外したシートは結合プロセスで完全にスキップされます。
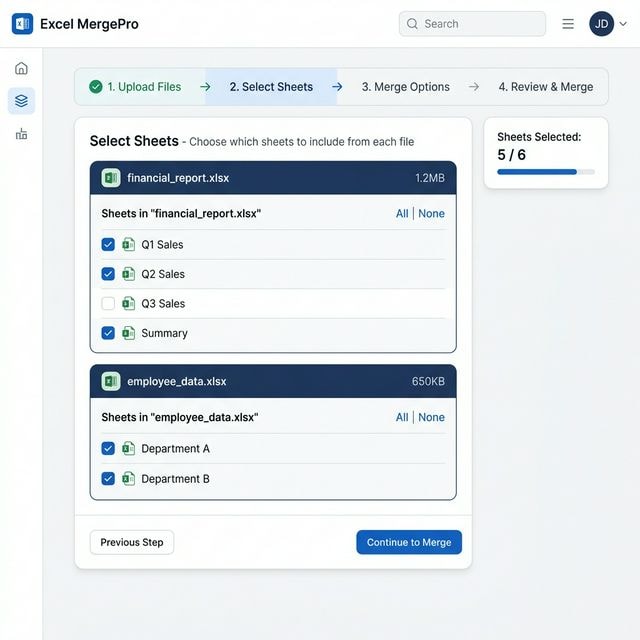
結合出力に含めたくないサマリーシート、チャート、メタデータシートがワークブックに含まれている場合に特に便利です。
結合をクリックして即座に結合ファイルを取得
すべての設定が完了したら、「ファイルを結合」ボタンをクリックします。ツールはブラウザ内でローカルにすべてのファイルを処理 — サーバーにはアップロードされません。結合が完了すると、緑色の成功バナーが表示され、「ダウンロード」ボタンがアクティブになります。ダウンロードをクリックして結合されたXLSXファイルを保存。ソーシャル共有ボタンでツールを同僚と共有することもできます。
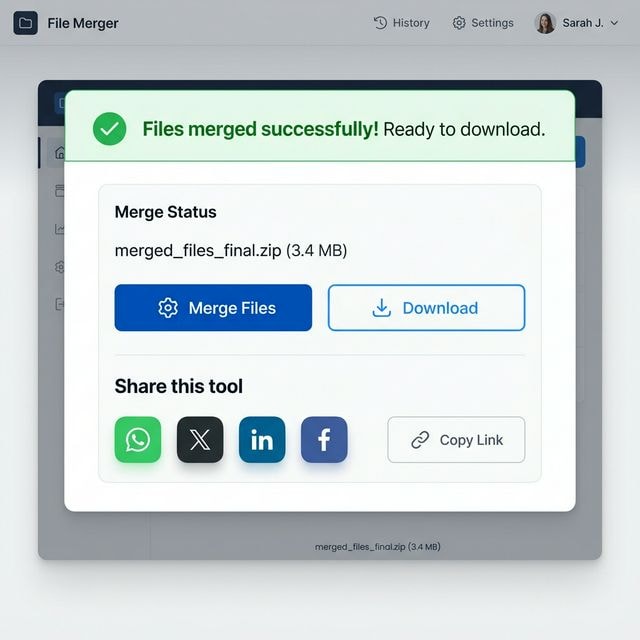
出力は常にモダンなXLSXファイルとして保存され、Excel、Google Sheets、その他のスプレッドシートアプリケーションとの最大互換性を確保します。
結合モードの詳細
シナリオに合った結合モードを選択
単一スプレッドシート
すべてのファイルのデータを1つの連続シートに積み重ねます。月次レポート、アンケートバッチ、地域別データエクスポートなど、同じ列構造を持つファイルの結合に最適。最初のファイルからヘッダーが保持され、スマート列マッチングがデータを自動整列。
最適な用途:月次レポート、アンケートデータ、類似構造のエクスポート
複数シート
各アップロードファイルを1つのワークブック内の名前付きタブとして配置。各ファイルの元のデータ構造は完全に保持されます。データを混在させずに1つのワークブックにファイルを統合したい場合に最適。
最適な用途:ソース別整理、複数レポートのアーカイブ
選択的結合
各ワークブックから結合に含めるシートを完全にコントロール。複数シートのExcelファイルをアップロードし、必要なシートだけを選択。未選択のシートは完全にスキップされます。
最適な用途:複数シートワークブック、特定データの抽出
詳細オプションガイド
結合プロセスのあらゆる側面を微調整
ヘッダー処理
結合中の列ヘッダーの扱いを制御。「ヘッダー保持」は最初のファイルのヘッダー行のみを保持し、重複を防止。「シートラベル追加」は各ファイルのデータの前にソースシート名を挿入して識別を容易に。「処理なし」はすべての行を均等に扱い、特別なヘッダーロジックなし。
データ範囲
結合を特定のセル範囲に限定。開始セル(例:A1)と終了セル(例:Z1000)を入力して各ファイルの一部のみを抽出。メインデータエリア外の追加メタデータ、メモ、書式が含まれるファイルに便利。
書式保持
ソースファイルの元のセル書式、色、フォントスタイル、条件付き書式を結合出力に保持。無効にすると、生データ値のみが転送されます。
PDF to Excel Converter
Extract tables and data from PDF documents into clean, editable Excel spreadsheets. Smart table detection with multiple extraction modes.
Drag and drop or click to select a PDF
Start by uploading your PDF file using the drag-and-drop zone. The tool accepts standard PDF files up to 50 MB. Once uploaded, the file name, size, and PDF badge are displayed. If your PDF is password-protected, a password field will appear automatically — just enter the password to unlock it.
For best results, use PDFs with clearly structured tables rather than scanned images. Scanned PDFs may produce lower-quality results. For scanned documents, try our Image to Excel (OCR) tool instead.
Choose extraction mode, output format, and options
In the options panel on the right, configure how your PDF data should be extracted. Choose from three Extraction Modes: Auto (automatically detects tables and text), Table Mode (optimized for structured tabular data), or Lines Mode (extracts text line by line). Select your Output Format — XLSX for Excel or CSV for plain text. Set a Page Range (e.g., "1-3, 5") to convert only specific pages. Choose a Delimiter (Auto, Tab, Pipe, Comma, Semicolon, or Space) to control how columns are separated. Enable "Sheet per page" to place each PDF page into a separate Excel sheet tab.
Use "Auto" extraction mode for most PDFs — it intelligently detects whether the content is a table or plain text. Use "Table" mode only when you know the PDF contains structured tabular data with clear rows and columns.
Check the extracted data before converting
Click the "Preview" button to see a preview of the extracted data before committing to the full conversion. The preview shows a paginated table view with row counts, column counts, and total pages detected. This lets you verify the extraction quality and adjust settings if needed before downloading.
Always preview first when working with complex PDFs that have mixed content (tables, paragraphs, headers). This saves time by letting you adjust settings before the full conversion.
Process and download your Excel file
Click the "Convert Now" button to process the full PDF conversion. A progress indicator shows the conversion status. Once complete, a green success banner appears with the conversion time. Click the "Download" button to save your converted XLSX or CSV file. The output file name is automatically generated from your original PDF name with a timestamp.
The converted XLSX file is compatible with Microsoft Excel, Google Sheets, LibreOffice Calc, and all major spreadsheet applications.
Key Features
Smart Table Detection
Automatically detects tables in your PDF and extracts structured data into clean spreadsheet columns.
3 Extraction Modes
Auto, Table, and Lines modes let you choose the best extraction method for your PDF content.
Password Support
Unlock and convert password-protected PDFs by entering the document password.
Page Range Selection
Convert only specific pages (e.g., "1-3, 5") instead of the entire document.
Sheet Per Page
Place each PDF page into a separate Excel sheet tab for organized output.
Preview Before Download
Check extracted data in a table preview before committing to the full conversion.
Excel Splitter
Split large Excel files into smaller pieces with 9 powerful split modes — by rows, sheets, columns, formulas, dates, file size, and more.
Drag and drop or click to upload XLS, XLSX, or CSV
Upload a single Excel or CSV file using the drag-and-drop zone at the top of the page. The tool accepts XLS, XLSX, and CSV formats. Once uploaded, a step progress bar updates to show you are in the "Configure" phase. The file info panel shows the file name, detected sheets, total rows, and columns.
For very large files (50,000+ rows), close other browser tabs to free up memory. All processing happens locally in your browser, so performance depends on your device.
Choose from 9 powerful split modes
Use the Split Configuration panel on the right to choose how your file should be split. The tool offers 9 split modes: By Fixed Rows (split every N rows), By File Count (divide into N equal files), By Sheet (each sheet as a separate file), By Column Value (group rows by a column's value), By Blank Rows (split at empty rows), By File Size (limit each output file's size), By Formula Type (separate formula cells from value cells), By Expression (custom conditions), and By Date Range (time-based groups). Each mode has its own configuration options that appear when selected.
The "By Column Value" mode is incredibly powerful for splitting sales data by region, employee records by department, or survey responses by category — any column with repeating group values.
Refine your data and save split configurations
Use the Data Filters panel to narrow down which rows are included before splitting. You can filter by column values, exclude empty rows, or set conditions. The Template Manager lets you save your split configuration as a reusable template — perfect for recurring tasks like monthly report splitting. Simply save a template, and load it next time to apply the same settings instantly.
Save templates for split configurations you use regularly. For example, create a "Monthly Sales Split" template that splits by the "Region" column and filters for the current month.
Check your data before splitting
Switch between four tabs below the upload area: Preview (see your data in a table), Results (view split output after processing), Statistics (column stats, value distributions, data type breakdowns), and Formulas (detect and inspect Excel formulas). The Preview tab shows your raw data with pagination and column headers. The Statistics tab gives you a powerful analytical overview of your dataset.
Use the Formulas tab to check if your file contains Excel formulas before splitting. The tool preserves formulas across split files, but it is good to know what formulas are present.
Process your file and download results
Click the "Split Now" button to process your file. The step progress bar updates to show the "Split" phase, and then moves to "Results" when complete. Switch to the Results tab to see all generated files. You can download individual files or download all files at once as a ZIP archive. Each output file is named based on your split criteria (e.g., by column value or row range).
You can click "New File" at any time to reset and upload a different file. Your split configuration and templates are preserved.
9 Supported Split Modes
By Fixed Rows
Split every N rows — perfect for breaking large datasets into manageable chunks.
By File Count
Divide into N equal files — ideal when you need a specific number of output files.
By Sheet
Each sheet becomes a separate file — great for multi-sheet workbooks.
By Column Value
Group rows by a column value — perfect for categorizing data by region, department, etc.
By Blank Rows
Split at empty rows — useful for data with natural section breaks.
By File Size
Limit each output file size — handy when email or system upload limits apply.
By Formula Type
Separate formula cells from value cells — useful for data auditing.
By Expression
Custom conditions and expressions — maximum flexibility for power users.
By Date Range
Time-based groups — split data by week, month, quarter, or year.
Excel to JSON Converter
Convert Excel (XLS, XLSX) and CSV files to structured JSON with advanced options for nested objects, type parsing, and custom formatting.
Drag and drop or click to select a file
Upload a single Excel (XLS, XLSX) or CSV file using the drag-and-drop zone. The tool processes files entirely in your browser — nothing is uploaded to any server. Once a file is uploaded, the tool automatically detects all available sheets and displays them in the options panel. The file name and size are shown below the upload area.
This tool processes everything locally using the SheetJS library. Your data never leaves your device, making it safe for sensitive financial or personal data.
Choose format, indentation, and data parsing rules
In the options panel on the right, configure your JSON output. Select which Sheets to process by checking/unchecking individual sheets. Choose a Structure Format: Flat Array (array of row objects — best for APIs), Object Dictionary (object with sheet names as keys — for multi-sheet files), or Wrapped Root ({ data: ... } wrapper — for frameworks). Pick Indentation: 2 spaces (readable), 4 spaces (more spaced), or Minified (smallest file size). Set Empty Cells handling: Omit (skip empty cells), Null (set to null), or Empty String (set to "").
Use "Flat Array" format for single-sheet files when you need clean API-ready JSON. Use "Object Dictionary" when your file has multiple sheets and you want to preserve the sheet structure.
Control nested objects, type parsing, and date formats
Toggle three advanced data parsing options: Nested Objects — when enabled, column headers with dots (like "address.city") are converted into nested JSON objects ({ address: { city: "..." } }). Auto-Parse Types — keeps numbers, booleans, and dates as their native types instead of converting everything to strings. Raw Date Format — when enabled, preserves Excel's internal date serial numbers instead of converting to JavaScript Date objects.
Enable "Nested Objects" if your column headers use dot notation (e.g., "user.name", "user.email") — the tool will automatically create nested JSON structures from flat spreadsheet columns.
Process your file and get JSON output
Click the "Convert Now" button to generate JSON from your spreadsheet. The output appears in a syntax-highlighted preview panel below, showing the first 5,000 characters. The file size of the generated JSON is displayed. Click "Download" to save the JSON file. The downloaded file name matches your original file name with a .json extension.
You can copy the JSON directly from the preview panel for quick use. For large files, the preview is truncated but the full JSON is included in the download.
Key Features
Multiple Output Formats
Flat Array, Object Dictionary, or Wrapped Root — choose the best structure for your use case.
Nested Object Support
Column headers with dots are converted to nested JSON objects automatically.
Sheet Selection
Choose which sheets to include — process one sheet or all sheets at once.
Type Preservation
Numbers, booleans, and dates are preserved as native JSON types, not strings.
Minified or Pretty
Choose 2-space, 4-space, or minified indentation for your output.
100% Client-Side
All processing happens in your browser. Your data never leaves your device.
Mail Merge Generator
Generate bulk personalized letters, emails, and documents from Excel or CSV data using {{Tag}} placeholders. Export as TXT, HTML, or PDF.
Upload an Excel or CSV file with your records
Upload an Excel (XLS, XLSX) or CSV file containing your data records. The tool reads the first sheet and displays all detected columns. A data table preview shows all your records with column headers. You can search and filter records using the search bar above the table. The record count is displayed showing matching vs. total records. Don't have a file? Click "Try Demo" to load sample customer data instantly and explore the tool.
Make sure your column headers are in the first row. Trailing spaces in column names are automatically trimmed. The tool reads the first sheet of multi-sheet workbooks.
Create a rich-text template with {{Tags}} for personalization
Write your document template in the rich-text editor. Insert data placeholders by clicking column name buttons below the editor — each click inserts a {{ColumnName}} tag at the cursor position. The editor supports rich text formatting: Bold, Italic, Underline, Headings (H1, H2), Paragraph, Bullet Lists, Numbered Lists, Text Alignment (Left/Center/Right), Text Color, and Clear Formatting. You can also add a Subject Line Template for email drafts. Use {{#if Status}} conditional {{/if}} blocks for conditional content. Insert dynamic QR codes with {{qr ColumnName}} and dynamic images with {{img ImageURLColumn}}.
Your template is automatically saved to localStorage — so even if you close the browser, your template is preserved when you return. Click "Load Demo Template" to see an example template.
See live previews of each personalized document
The Preview panel on the right shows a live, rendered preview of your template merged with actual data. Use the left/right navigation arrows to cycle through all records and see how each personalized document looks. The preview renders rich text, images, and QR codes in real-time. You can also preview the Subject Line merged with the current record. Copy the rendered body to clipboard with "Smart Copy" (preserves HTML formatting), copy the subject line separately, or click "Open in Email App" to launch your default email client with the preview pre-filled.
Use "Smart Copy (Email Body)" to copy the rendered HTML to your clipboard — it preserves bold, italic, lists, and formatting when pasted into email clients like Gmail or Outlook.
Choose output format, filename pattern, and generate documents
In the Download section, choose your output format: TXT (plain text), HTML (rich formatted), or PDF (printable documents). Set a Filename Pattern using {{Tags}} — for example, "invoice_{{Name}}.html" generates unique filenames for each record. The {{row}} tag inserts the row number. Click "Generate & Download ZIP" to create all documents at once. A real-time progress bar shows generation status. Once complete, the ZIP file downloads automatically containing all personalized documents. The ZIP file size is displayed after generation.
PDF generation uses html2canvas for high-quality rendering. For large datasets (100+ records), TXT and HTML formats are significantly faster than PDF because each PDF requires rendering.
Power Features
Rich Text Editor
Full formatting toolbar — bold, italic, headings, lists, alignment, colors, and more.
{{Tag}} Placeholders
Click column names to insert personalization tags at the cursor position.
Conditional Logic
Use {{#if}} blocks to show/hide content based on data values.
Dynamic QR Codes
Generate QR codes from any data column using {{qr ColumnName}}.
Dynamic Images
Embed images from URL columns using {{img ImageURLColumn}}.
Multi-Format Output
Export as TXT, HTML, or PDF — all delivered in a ZIP archive.
Live Preview
See each personalized document rendered in real-time with record navigation.
Auto-Save Templates
Templates are saved to localStorage and persist across browser sessions.
Template Quick Reference
Conditional Logic
{{#if Status}}Paid{{/if}}{{#unless Paid}}Overdue{{/unless}}Dynamic QR Code
{{qr Email}} → generates QR imageDynamic Image
{{img PhotoURL}} → embeds imageImage to Excel (OCR)
Extract text and tables from images using OCR technology. Convert photos, screenshots, receipts, and scanned documents to Excel spreadsheets.
Drag and drop or click to select image files
Upload one or more images using the drag-and-drop zone. Supported formats include PNG, JPG/JPEG, WebP, BMP, and TIFF. You can upload multiple images at once (up to 20 MB each). Uploaded images are displayed as thumbnails with file name and size. Remove individual images with the delete button, or clear all images to start over. The tool processes images entirely in your browser using Tesseract.js OCR.
For best OCR accuracy, use clear, high-resolution images with good contrast. Screenshots of spreadsheets work very well. Blurry or low-resolution photos may produce lower-quality results.
Choose language, extraction mode, and enhancement options
In the options panel, configure your OCR settings. Select the OCR Language from 20+ supported languages including English, Hindi, German, French, Spanish, Japanese, Korean, Chinese (Simplified/Traditional), Arabic, and more. Choose an Extraction Mode: Table (detects and reconstructs table grid from word positions) or Lines (extracts text line by line). Select Output Format: XLSX or CSV. Enable "Sheet per Image" to place each image's data on a separate Excel sheet. Toggle Image Enhancement to preprocess images for better OCR accuracy — with three strength levels (Low, Medium, High). Enable Auto-Upscale to automatically enlarge small images for improved text recognition.
Always enable Image Enhancement for photos and scanned documents. The preprocessing pipeline applies grayscale conversion, contrast adjustment, and Otsu's binarization — dramatically improving OCR accuracy.
Run OCR and review extracted data with confidence scores
Click "Convert to Excel" to start the OCR process. A progress indicator shows the current status: loading language model, enhancing image, and recognizing text — with per-image progress. Once complete, extracted data is displayed in a table preview with per-cell confidence color coding: Green (≥80% confidence — high accuracy), Yellow (50-80% — may need review), and Red (<50% — likely needs correction). You can click any cell to edit its content inline — corrections are applied instantly. The overall confidence score and conversion time are displayed.
Pay special attention to cells with yellow or red confidence highlights — these are the most likely to contain OCR errors. Click directly on any cell to correct the text before downloading.
Download the converted spreadsheet
Click "Download" to save the converted file as XLSX or CSV. If you enabled "Sheet per Image" with multiple images, each image's data appears on its own named sheet tab. Column widths are automatically adjusted to fit the content. If you edited any cells after OCR, click "Regenerate File" to update the download with your corrections before saving.
Use "Sheet per Image" when converting multiple related images (like multi-page scanned documents) to keep each page's data organized in separate tabs within one workbook.
OCR Features
20+ Languages
English, Hindi, German, French, Spanish, Japanese, Korean, Chinese, Arabic, and many more.
Smart Table Reconstruction
Spatial analysis of word positions reconstructs table grids from images.
Image Enhancement
Grayscale conversion, contrast adjustment, and Otsu's binarization for better accuracy.
Auto-Upscale
Automatically enlarges small images for improved text recognition.
Inline Cell Editing
Click any extracted cell to correct text directly before downloading.
Confidence Scoring
Per-cell color coding shows OCR confidence — green, yellow, or red.
Multi-Image Batch
Process multiple images at once with optional sheet-per-image output.
100% Client-Side
Tesseract.js runs entirely in your browser. No image uploads to any server.
Supported Image Formats
Maximum file size: 20 MB per image. Multiple images can be processed at once.
最良の結果を得るためのプロのヒント
最もクリーンな単一スプレッドシート結合のため、すべてのファイルで同じ列順序と命名を確保。
大きなファイル?他のブラウザタブを閉じてメモリを解放し、処理を高速化。
グリップハンドルをドラッグしてファイルを並べ替え — 結合順序はファイルリストの順序と一致。
1回の結合操作でXLS、XLSX、CSVファイルを混在可能。
すべての処理はブラウザ内で行われ、ファイルはデバイスから出ません。
乱雑なスプレッドシートのヘッダー行やフッターメモをスキップするにはデータ範囲オプションを使用。